Tutorial 2 : using the downloader
The following scenario uses the same demo data of the Kyritz-Ruppiner Heide. But this time we are using the build-in downloader to get an image stack.
The first two steps are the same as in Tutorial 1: classifying a custom image stack with existing reference data.
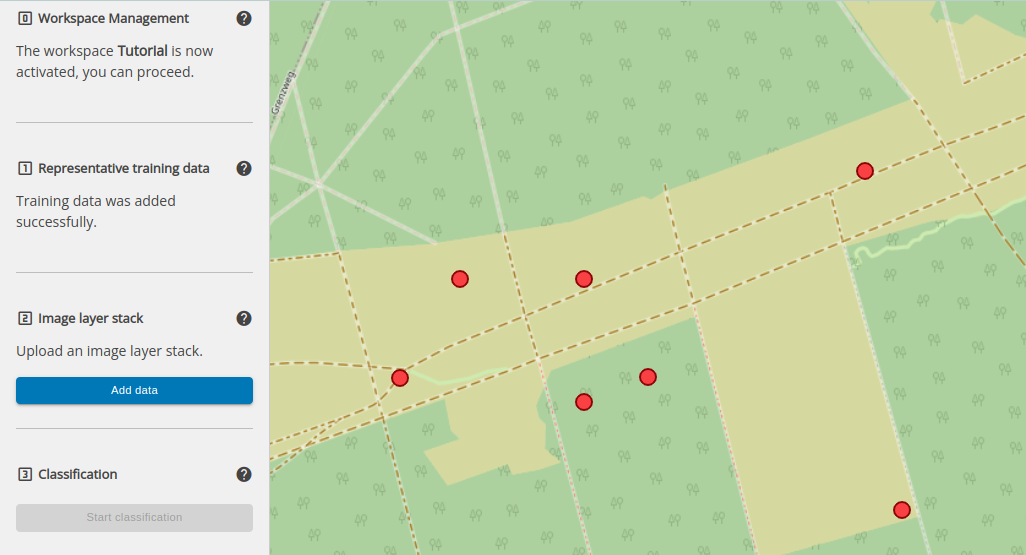
We create a workspace and upload our reference data which is a shapefile. The reference points are then rendered on the map:
Step 2: Input of an image layer stack
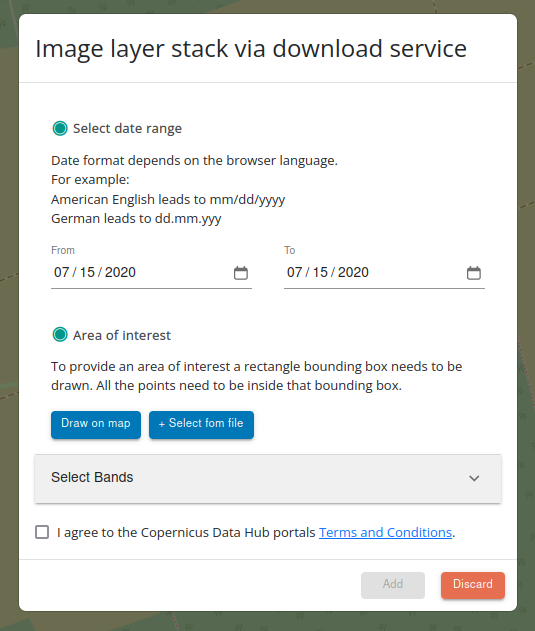
Here we choose the second option: Image layer stack via download service:

Option B) Image layer stack via download service
For downloading a stack we first need to select a time range. In this example we choose 07/15/2019 to 07/15/2020.
We have two options to choose the area of interest for the following surface classification. In this tutorial we use
the method Draw on map. Not part of this tutorial, but another option would be to upload an area of interest using a zipped shapefile. For this we would click on the button Select from file.
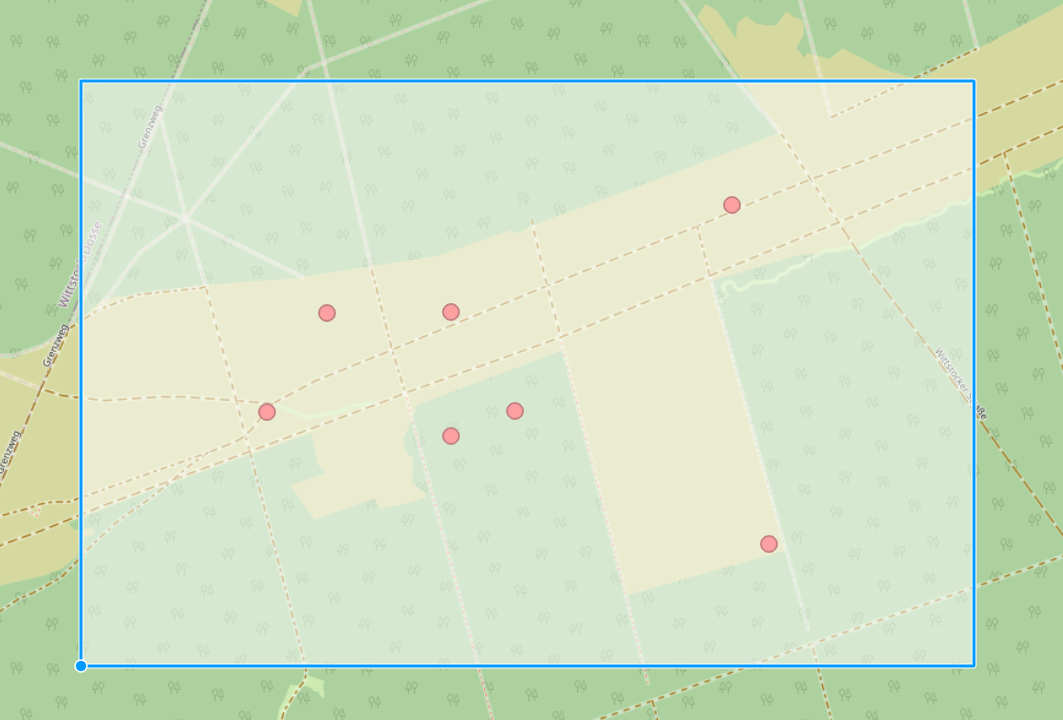
After clicking on the button where we draw the bounding box by ourselves, we are taken back to the map. Make sure to include all reference points in the area of interest:
Below we can de-select bands. Per default all bands are selected. We will stick to the default here and keep all the bands.
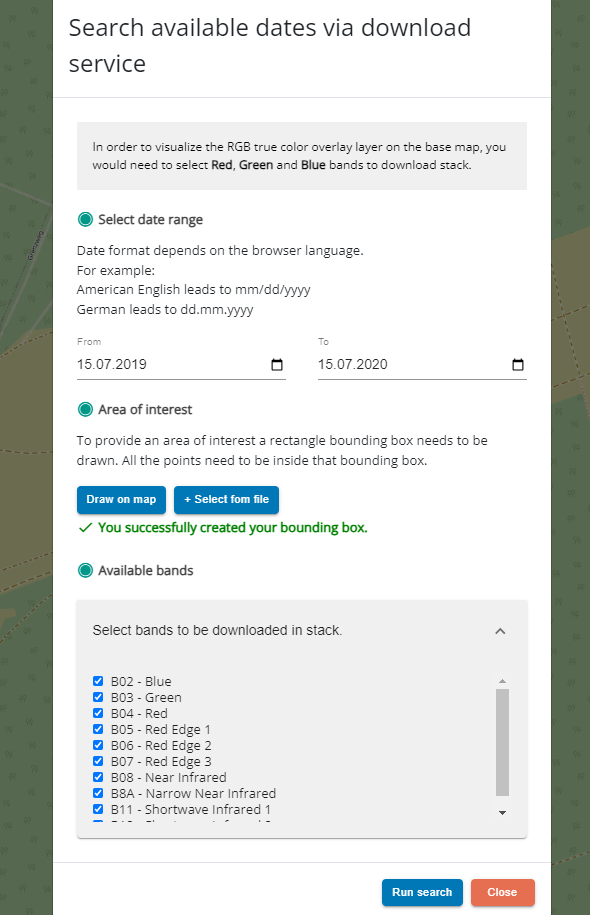
After clicking on Run search a request is send to get all available dates for the selected time range. From these dates
we can select 3 to 12:
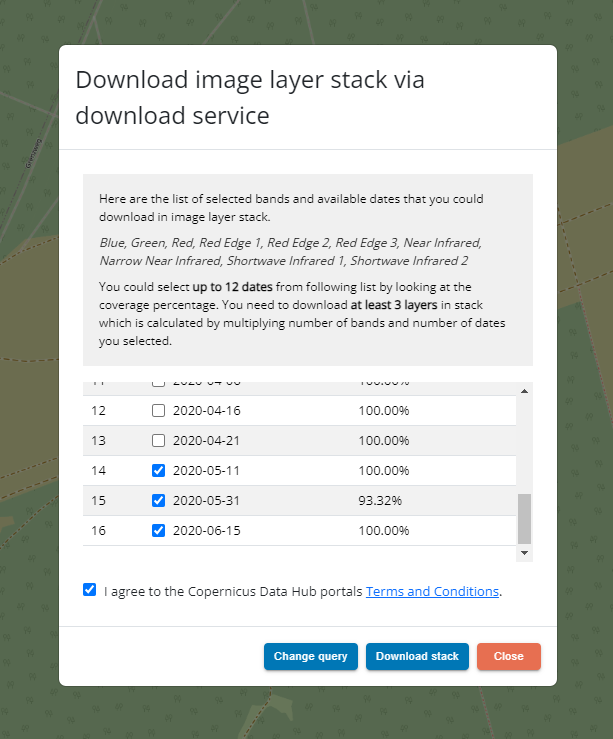
We also have to tick the box that we agree to the Copernicus Data Hub portals Terms and Conditions to interactively download data.
Afterwards we can either change our settings via Change query or start the download by clicking on Download stack.
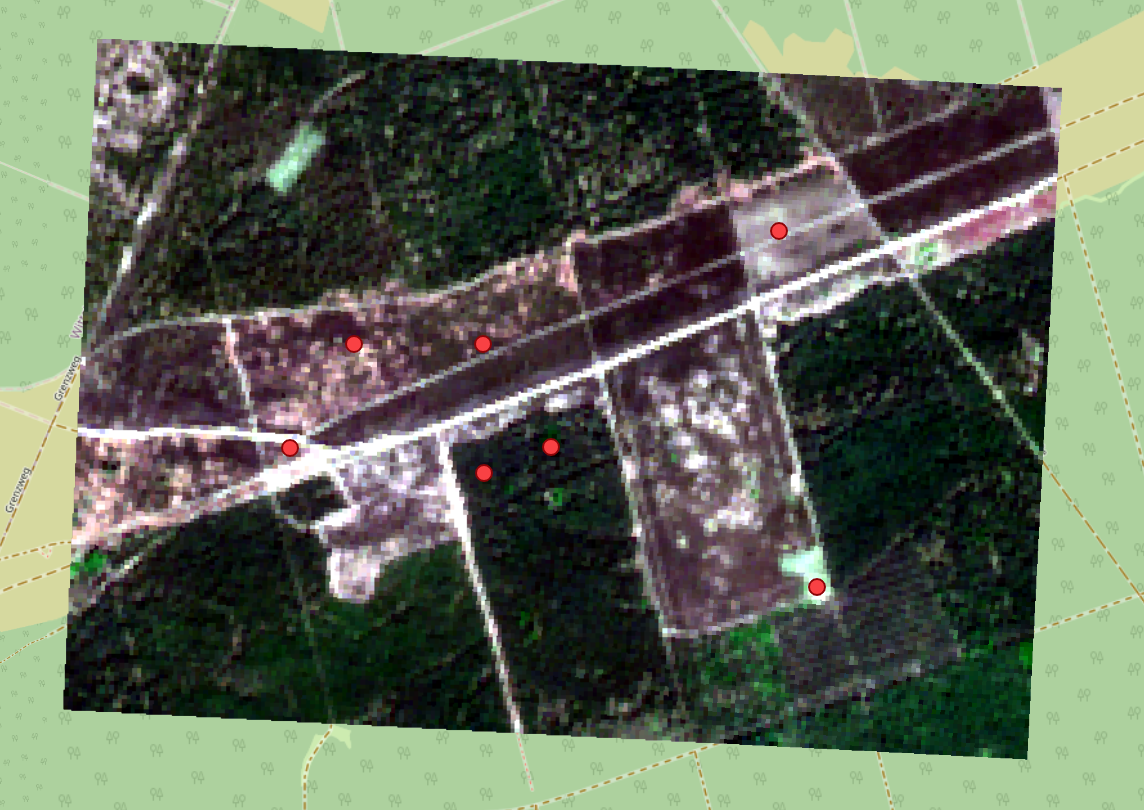
Depending on the length of the time range, the size of the bounding box and the number of bands the download can take a while. After downloading the stack is rendered to the map and should look something like this:
The classification and the rendering of the results is again the same as in tutorial 1.